Sunday, September 20, 2020

Data Science - A Modern data lakes

A modern data lake enables organizations to efficiently store, manage, access, and generate value out of data stored in both on premise storage infrastructures as well as in the cloud, allowing organizations to apply next-generation data analytics and ML technologies to generate value from this data. The cost of bad data quality can be counted in lost opportunities, bad decisions, and the time it takes to hunt down, cleanse, and correct bad errors. Collaborative data management, and the tools to correct errors at the point of origin, are the clear ways to ensure data quality for everyone who needs it.

The old data lake terminology supposes to have many challenges where value of the data is not realized such as —

  1. They lead to multiple copies of raw, transformed and structured data has been created and no single source of truth
  2. Data silos from traditional data warehouse not handling unstructured data, additional systems needed
  3. They are built primarily to offer an expensive storage. So, analytics performances slowly and they have limited though put for queries, concurrent users
  4. They are complex and costly, requiring significant tuning and configuration across multiple products
  5. Non-SQL use cases require new copies of data for data science and machine learning
  6. They have limited security and ungoverned capabilities

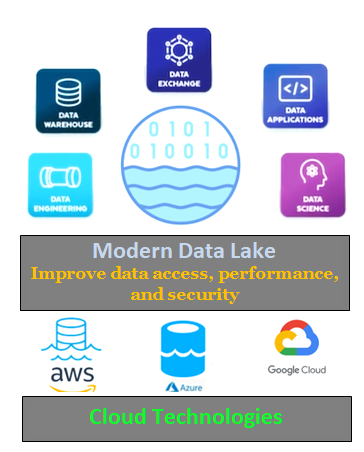
The above challenges usually resolved within Modern data lakes Technologies for handling all structured and unstructured data in a central repository.

Integrated and Extensible Data Pipelines — Cost effective pipelines to progressively refine reliable data through data lake tables. Rely on pipelines scaling reliably and in real time to handle heavy data workloads and extensible data transformations to suit business’s unique needs.

Use built-in smart features to accelerate your Modern data lake. Today, almost everyone has big data, machine learning, and cloud at the top of their IT “to-do” list. The importance of these technologies can’t be overemphasized, as all three are opening up innovation, uncovering opportunities, and optimizing businesses.

Build and run integrated, performance and extensible data pipelines to process all your data, and easily unload the data back into Modern data lake to store the data with efficient data compression.

Self-service for data scientists and ML engineers — With complete, reliable, and secure data available in Modern data lake, your data teams are now ready to run exploratory data science experiments and build production ready machine learning models. Integrated cloud-based tools with Python, Scala, Hive, R, Pyspark and SQL make it easy for teams to share analysis and results.

Exceptional Query Performance —SQL and ML together on modern data lake with a single copy of data. Open data formats ensure data is accessible across all tools and teams, reducing lock-in risk. Enable efficient data exploration, with instant and near-infinite scalability and concurrency.

Secure, Governed Collaboration — Build once, access many times across use cases for a consolidated administration and self-service. Helps to meet governance and security standards for collaborative data preparation, exploration, and analytics no matter where data resides.

Make Data a Team Sport To Take Up Data Challenges — Data quality is often perceived as an individual task of the data engineer. As a matter of fact, nothing could be further from the truth. Data quality is now increasingly becoming a company-wide strategic priority involving professionals from every corner of the business. To succeed, working like a sports team is a way to illustrate the key ingredients needed to overcome any data quality challenge.

As in team sports, you will hardly succeed if you just train and practice alone. You have to practice together to make the team successful. Also, just as in team sports, Business/IT teams require having the right tools, taking the right approach and asking committed people to go beyond their daily tasks to tackle the data quality challenge one step at a time.

It’s all about strengthening your data quality muscles by challenging IT and the rest of the business to work together. For that, you need to proceed with the right model, the right process and the right solution for the right people.

Eliminates old model :Too few people access too little data — The old model was about allowing a few people to access a small amount of data. This model worked for many years to build data warehouses. The model relies on a team of experienced data professionals armed with well-defined methodologies and well-known best practices. They design an enterprise data warehouse, and then they create data marts, so the data can fit to a business domain. Finally, using a business intelligence tool, they define a semantic layer such as a “data catalog” and predefined reports. Only then can the data be consumed for analytics.

Modern Data lakes then came to the rescue as an agile approach for provisioning data. You generally start with a data lab approach targeting a few data-savvy data scientists. Using cloud infrastructure and big data, you can drastically accelerate the data ingestion process with raw data. Using schema on read, data scientists can autonomously turn data into smart data.

This more agile model has multiple advantages over the previous one. It scales across data sources, use cases, and audiences. Raw data can be ingested as it comes with minimal upfront implementation costs, while changes are straightforward to implement

Collaborative & Governed Model — By introducing a Wikipedia-like approach where anyone can potentially collaborate in data curation, there is an opportunity to engage the business in contributing to the process of turning raw data into something that is trusted, documented, and ready to be shared.

By leveraging smart and workflow-driven self-service tools with embedded data quality controls, we can implement a system of trust that scales. IT and other support organizations such as the office of the CDO need to establish the rules and provide an authoritative approach for governance when it is required (for example for compliance, or data privacy.)

Choosing The Right Tools — Data profiling is the process of gauging the character and condition of data stored in various forms across the enterprise — is commonly recognized as a vital first step toward gaining control over organizational data. The right data pipeline tool delivers rich functionality that gives you broad and deep visibility into your organization’s data:

  1. Jump-start your data profiling project with built-in data connectors to easily access a wide range of databases, file types, and applications, all from the same graphical console
  2. Use the Data Explorer to drill down into individual data sources and view specific records
  3. Perform statistical data profiling on your organization’s data, ranging from simple record counts by category, to analyses of specific text or numeric fields, to advanced indexing based on phonetics and sounds
  4. Apply custom business rules to your data to identify records that cross certain thresholds, or that fall inside or outside of defined ranges
  5. Identify data that fails to conform to specified internal standards such as SKU or part number forms, or external reference standards such as email address format or international postal codes
  6. Improve your data with standardization, cleansing and matching. It also allows you to identify non-duplicates or defer to an expert the decision to merge or unmerge potential duplicates
  7. Share quality data without unauthorized exposure. User can selectively share production quality data using on premises or cloud-based applications without exposing Personally Identifiable Information (PII) to unauthorized people

Modern data stewardship — As a critical component of data governance, data stewardship is the process of managing the data life cycle from curation to retirement. With more data-driven projects being launched, “bring your own data” projects by the lines of business, and increased use of data by data professionals in new roles and in departments like marketing and operations, there presents a need to rethink data stewardship.

To learn more, please follow us -

http://www.sql-datatools.com

To Learn more, please visit our YouTube channel at - 

http://www.youtube.com/c/Sql-datatools

To Learn more, please visit our Instagram account at -

https://www.instagram.com/asp.mukesh/

To Learn more, please visit our twitter account at -

https://twitter.com/macxima

To Learn more, please visit our Medium account at -

https://medium.com/@macxima

Saturday, September 19, 2020

Introduction - PySpark for Big Data

Spark is written in Scala and runs on the JVM and we can use all the features of it in python through PySpark. Programs written in PySpark can be submitted to a Spark cluster and run in a distributed manner.

PySpark is a Python API for Spark to support the collaboration of Apache Spark and Python.

Actually Apache Spark is made up of several components and at its core; Spark is a generic engine for processing large amounts of data.

A PySpark program isn’t that much different from a regular Python program, but the execution model can be very different from a regular Python program, especially if we’re running on a cluster.

Advantages of using PySpark:

  1. Python is almost 29 years old language in the programming era which is easy to learn and implement
  2. Python has a very strong community support to deal with most of the problems
  3. Py4J is a popular library which is integrated within PySpark and allows python to dynamically interface with JVM objects.
  4. It provides simple and comprehensive API
  5. With Python, the readability of code, maintenance, and familiarity is far better
  6. It features various options for data visualization, which is difficult using Scala or Java

How to setup PySpark on your machine?

Version — spark-3.0.0-bin-hadoop3.2

Notes — create spark directory on your desktop and put the above spark version there and then create the three system variables –

SPARK_HOME: this variable must be mapped with your spark directory,

HADOOP_HOME: this variable should be mapped with your Hadoop directory inside the spark directory such as %SPARK_HOME%\hadoop

PYTHONPATH: this variable should be mapped with your python directory inside the spark directory such as %SPARK_HOME%\python;%SPARK_HOME%\python\lib\py4j-0.10.9-src.zip:%PYTHONPATH%

Components of PySpark

  1. Cluster — Cluster is nothing more than a platform to install Spark; Apache Spark is a Big Data processing engine. Spark can be run in distributed mode on the cluster, with a least one driver and a master, and others as Spark workers. The Spark driver interacts with the master to find out where the workers are, and then the driver federates tasks to the workers for computation.
  2. SparkContext is the entry gate of Apache Spark functionality. The most important step of any Spark driver application is to generate SparkContext. It acts as the master of the Spark application
  3. SQLContext is the main entry point for Spark SQL functionality. A SQLContext can be used create DataFrame, register DataFrame as tables, execute SQL over tables, cache tables, and read parquet files.
  4. Native Spark: If we use Spark data frames and libraries, then Spark will natively parallelize and distribute our task. First, we’ll need to convert the Pandas data frame to a Spark data frame and then do the needful business operations.
  5. Thread Pools: The multiprocessing library can be used to run concurrent Python threads, and even perform operations with Spark data frames.
  6. Pandas UDFs — With this feature, we can partition a Spark data frame into smaller data sets that are distributed and converted to Pandas objects, where our function is applied, and then the results are combined back into one large Spark data frame.

How does PySpark work?

By default, Spark’s scheduler runs jobs in FIFO fashion. Each job is divided into “stages” (e.g. map and reduce phases), and the first job gets priority on all available resources while its stages have tasks to launch, then the second job gets priority, etc. If the jobs at the head of the queue don’t need to use the whole cluster, later jobs can start to run right away, but if the jobs at the head of the queue are large, then later jobs may be delayed significantly.

  1. MultiThreading — The threading module uses threads where threads run in the same memory space. Since threads use the same memory, precautions have to be taken or two threads will write to the same memory at the same time. It is a good option for I/O-bound applications. Benefits –

a. Multithreading is concurrency

b. Multithreading is for hiding latency

c. Multithreading is best for IO

2. MultiProcessing — The multiprocessing module uses processes where processes have separate memory. Multiprocessing gets around the Global Interpreter Lock and it takes advantage of multiple CPUs & cores. Benefits –

a. Multiprocessing is parallelism

b. Multiprocessing is for increasing speed

c. Multiprocessing is best for computations

3. Map() function

map() applies a function to each item in an iterable, but it always produces a 1-to-1 mapping of the original items.

Key features of PySpark — PySpark comes with various features as given below:

  1. Real-time Computation — PySpark provides real-time computation on a large amount of data because it focuses on in-memory processing. It shows the low latency
  2. Support Multiple Language — PySpark framework is suited with various programming languages like Scala, Java, Python, SQL, and R. Its compatibility makes it the preferable frameworks for processing huge datasets
  3. Caching and disk constancy — PySpark framework provides powerful caching and good disk constancy
  4. Swift Processing — It allows us to achieve a high data processing speed, which is about 100 times faster in memory and 10 times faster on the disk as stated by their development team
  5. Works well with RDD — Python programming language is dynamically typed, which helps when working with RDD
To learn more, please follow us -
To Learn more, please visit our YouTube channel at - 
To Learn more, please visit our Instagram account at -
To Learn more, please visit our twitter account at -
To Learn more, please visit our Medium account at -

Wednesday, September 16, 2020

Python — Extract Day Level Weather Data

Python - Weather Data Scrapping

If you are working as data scientist where you have to build some models to get the sales forecast then Weather data becomes a very important component to get the weather variables which plays as a root variables for your data model in your machine learning algorithms. You should now have a good understanding of how to scrape web pages and extract data.

There are many paid APIs which give you that specific data and they will have charged for every location. If you don’t have the sufficient project budget then you can write your own code (web scrapping code) in python to get your day level weather data for any particular location.
How Does Web Scraping Work? — When we scrape the web, we write code that sends a request to the server that’s hosting the page we specified. Generally, our code downloads that page’s source code, just as a browser would. But instead of displaying the page visually, it filters through the page looking for HTML elements we’ve specified, and extracting whatever content we’ve instructed it to extract.
Downloading weather data — We now know enough to proceed with extracting information about the local weather from the National Weather Service website. The first step is to find the page we want to scrape.
Image for post


Using CSS Selectors to get the weather info — We can also search for items using CSS selectors. These selectors are how the CSS language allows developers to specify HTML tags to style. Here are some examples: 
  • p a — finds all a tags inside of a p tag
  • body p a — finds all a tags inside of a p tag inside of a body tag.
  • html body — finds all body tags inside of an html tag.
  • p.outer-text — finds all p tags with a class of outer-text.
  • p#first — finds all p tags with an id of first.
  • body p.outer-text — finds any p tags with a class of outer-text inside of a body tag.

We now know enough to download the page and start parsing it. In the below code,  we: 
  • Download the web page containing the forecast.
  • Create a BeautifulSoup class to parse the page.

Import Python Libraries — we need some python libraries which help us in the web scrapping. Python Libraries for Web Scraping
  • requests — this critical library is needed to actually get the data from the web server onto your machine, and it contains some additional cool features like caching too.
  • Beautiful Soup 4 — This is the library we’ve used here, and it’s designed to make filtering data based on HTML tags straightforward.

  •  

    #Python program to scrape website 

    import bs4, re

    from bs4 import BeautifulSoup


    # The requests library

    import requests


    # Pandas is an open-source, BSD-licensed Python library providing high-performance,

    # easy-to-use data structures and data analysis tools for the Python programming language.

    import pandas as pd


    #import datetime library

    from datetime import datetime


    Public variables — these are the variables which will used inside the entire python code as given below –


    #define the base url

    base_url = "https://%s.meteoguru.uk/"


    #define the list of months for archive weather data

    lst=["may-2019","june-2019","july-2019","august-2019","september-2019","october-2019", "november-2019","december-2019","january-2020","february-2020","march-2020","april-2020","may-2020","june-2020","july-2019", "august-2020"]


    Python function for web scrapping — in this function, we will pass the web URL to download/scrap the whole web page. In this weather website, there are four div which are holding the weather data such as -

    1.       Finding all instances of a tag at once for beginning weekdays

    2.      Finding all instances of a tag at once for ending weekdays

    3.      Finding all instances of a tag at once for beginning weekend

    4.      Finding all instances of a tag at once for ending weekend

    In this function, we are using html parser for the web parsing and defining the dataframe for the data as given below -


below  is the code–  


#function to get weather data by url input parameter

def get_weather_data(url):

    #url='https://june-2020.meteoguru.uk/'

    page = requests.get(url)


    #Parsing a page with BeautifulSoup

    soup =  BeautifulSoup(page.content,'html.parser')


    # extract region

    region = soup.find("h2", attrs={"class": "mb-0"}).text.replace('Weather for ','').replace(', Archive','')


     # get next few days' weather dataframe

    ndf = pd.DataFrame(columns=["region","date", "day","weather", "max_temp", "min_temp","wind","humidity"])


    #Use the find method, which will return a single BeautifulSoup object

    days = soup.find("div", attrs={"class": "grid-wraper clearfix width100"}).find("div", attrs={"class": "row"})


    #Finding all instances of a tag at once for beginning weekdays

    for day in days.findAll("div", attrs={"class": "pl-0 pr-0 grid-box mb-1 rounded with-border width1_7 begining weekdays nextmonth"}):

        #print(day)

        date_name = day.find("div", attrs={"class": "pl-1 pr-1 rounded background-grey-1 width100"}).text.replace('\t','').replace('\n','').split(',')

        date=date_name[0]

        dayn=date_name[1]

        max_temp = day.find("p", attrs={"class": "pt-2 mb-1 center-text big-text-1 text-center"}).text.replace('\xa0','').replace('\t','').replace('\n','').replace('+','').replace('°C','')


        min_temp = day.find("p", attrs={"class": "pt-1 mb-0 pb-0 center-text"}).text.replace('\xa0','').replace('\t','').replace('\n','').replace('+','').replace('°C','')

        temp= day.find("span", attrs={"class": "mb-2 pt-0 mt-0 text-center width100 fz-08"}).text.replace('\xa0','').split(':')

        weather=temp[0]


        wind= temp[1].split(',')[0].replace('mph','')

        humidity= temp[3].replace('%','')

        #append dataframe

        ndf=ndf.append({"region":region,"date": date,"day":dayn, "weather": weather, "max_temp": max_temp, "min_temp": min_temp,"wind":wind,"humidity":humidity},ignore_index=True)


    #Finding all instances of a tag at once for ending weekend

    for day in days.findAll("div", attrs={"class": "pl-0 pr-0 grid-box mb-1 rounded with-border width1_7 ending weekend nextmonth"}):

        #print(day)

        date_name = day.find("div", attrs={"class": "pl-1 pr-1 rounded background-grey-1 width100"}).text.replace('\t','').replace('\n','').split(',')

        date=date_name[0]

        dayn=date_name[1]

        max_temp = day.find("p", attrs={"class": "pt-2 mb-1 center-text big-text-1 text-center"}).text.replace('\xa0','').replace('\t','').replace('\n','').replace('+','').replace('°C','')

        #max_temp = day.find("p", {"class": "pt-2 mb-1 center-text big-text-1 text-center"}).text.replace('\xa0','').replace('\t','').replace('\n','')

        min_temp = day.find("p", attrs={"class": "pt-1 mb-0 pb-0 center-text"}).text.replace('\xa0','').replace('\t','').replace('\n','').replace('+','').replace('°C','')

        temp= day.find("span", attrs={"class": "mb-2 pt-0 mt-0 text-center width100 fz-08"}).text.replace('\xa0','').split(':')

        weather=temp[0]

        #print(temp)

        wind= temp[1].split(',')[0].replace('mph','')

        humidity= temp[3].replace('%','')

        #append dataframe

        ndf=ndf.append({"region":region,"date": date,"day":dayn, "weather": weather, "max_temp": max_temp, "min_temp": min_temp,"wind":wind,"humidity":humidity},ignore_index=True)


    #Finding all instances of a tag at once for beginning weekend   

    for day in days.findAll("div", attrs={"class": "pl-0 pr-0 grid-box mb-1 rounded with-border width1_7 begining weekend nextmonth"}):

        #print(day)

        date_name = day.find("div", attrs={"class": "pl-1 pr-1 rounded background-grey-1 width100"}).text.replace('\t','').replace('\n','').split(',')

        date=date_name[0]

        dayn=date_name[1]

        max_temp = day.find("p", attrs={"class": "pt-2 mb-1 center-text big-text-1 text-center"}).text.replace('\xa0','').replace('\t','').replace('\n','').replace('+','').replace('°C','')

        #max_temp = day.find("p", {"class": "pt-2 mb-1 center-text big-text-1 text-center"}).text.replace('\xa0','').replace('\t','').replace('\n','')

        min_temp = day.find("p", attrs={"class": "pt-1 mb-0 pb-0 center-text"}).text.replace('\xa0','').replace('\t','').replace('\n','').replace('+','').replace('°C','')

        temp= day.find("span", attrs={"class": "mb-2 pt-0 mt-0 text-center width100 fz-08"}).text.replace('\xa0','').split(':')

        weather=temp[0]

        #print(temp)

        wind= temp[1].split(',')[0].replace('mph','')

        humidity= temp[3].replace('%','')

        #append dataframe

        ndf=ndf.append({"region":region,"date": date,"day":dayn, "weather": weather, "max_temp": max_temp, "min_temp": min_temp,"wind":wind,"humidity":humidity},ignore_index=True)


    #Finding all instances of a tag at once for ending weekdays      

    for day in days.findAll("div", attrs={"class": "pl-0 pr-0 grid-box mb-1 rounded with-border width1_7 ending weekdays nextmonth"}):


        date_name = day.find("div", attrs={"class": "pl-1 pr-1 rounded background-grey-1 width100"}).text.replace('\t','').replace('\n','').split(',')

        date=date_name[0]

        dayn=date_name[1]

        max_temp = day.find("p", attrs={"class": "pt-2 mb-1 center-text big-text-1 text-center"}).text.replace('\xa0','').replace('\t','').replace('\n','').replace('+','').replace('°C','')

        #max_temp = day.find("p", {"class": "pt-2 mb-1 center-text big-text-1 text-center"}).text.replace('\xa0','').replace('\t','').replace('\n','')

        min_temp = day.find("p", attrs={"class": "pt-1 mb-0 pb-0 center-text"}).text.replace('\xa0','').replace('\t','').replace('\n','').replace('+','').replace('°C','')

        temp= day.find("span", attrs={"class": "mb-2 pt-0 mt-0 text-center width100 fz-08"}).text.replace('\xa0','').split(':')

        weather=temp[0]

        #print(temp)

        wind= temp[1].split(',')[0].replace('mph','')

        humidity= temp[3].replace('%','')

        #append dataframe

        ndf=ndf.append({"region":region,"date": date,"day":dayn, "weather": weather, "max_temp": max_temp, "min_temp": min_temp,"wind":wind,"humidity":humidity},ignore_index=True)


    #return day level weather dataframe

    return ndf

Extracting all the information from the page — Now that we know how to extract each individual piece of information, we can combine our knowledge with css selectors and list comprehensions to extract everything at once from the web page and we have to generate a web url to call this method as given below -


if __name__ == “__main__”:

#define dataframe columns with headers
df=pd.DataFrame(columns=[“region”,”date”, “day”,”weather”, “max_temp”, “min_temp”,”wind”,”humidity”])


#new list for testing purpose
lst=[“may-2019”]

#for loop in case you have multiple months
for ymon in lst:
print(ymon)
url = base_url%(ymon)
print(url)
# get data
df = df.append(get_weather_data(url),ignore_index=True)
print(df.head())


After running the code, we get the following information's -

may-2019
https://may-2019.meteoguru.uk/

Call function for multiple locations — if you want to run the same code for the multiple locations then you have to create a new list to contain these locations as given below -


# weather location lists

loc=[“England”,”Wales”,”london”]

#base url for multiple locations

burl=’https://%s.meteoguru.uk/%s/'


Now, you can see that we have change the base URL also which is taken two parameters, first one %s is used for the weather month and second %s is used for the location as given below -


# weather location lists

loc=[“England”,”Wales”,”london”]

 #base url for multiple locations

burl=’https://%s.meteoguru.uk/%s/'

 #for loop for the location

for l in loc:

 #loop for the multiple month

for ymon in lst:

 #pass parameters in the base url

url = burl%(ymon,l)

 #print urls

print(url)

 #append dataframe

df = df.append(get_weather_data(url),ignore_index=True)

 #save dataframe into csv

df.to_csv(“weather_Uk.csv”, index=False)


https://may-2019.meteoguru.uk/England/
https://may-2019.meteoguru.uk/Wales/
https://may-2019.meteoguru.uk/london/

Combining our data into a Pandas Dataframe — We can now combine the data into a Pandas DataFrame and analyze it. A DataFrame is an object that can store tabular data, making data analysis easy. To learn more, please follow us -
To Learn more, please visit our YouTube channel at - 
To Learn more, please visit our Instagram account at -
To Learn more, please visit our twitter account at -
To Learn more, please visit our Medium account at -