Thursday, September 16, 2021

Python — A Tool for Everything

Data is a tool, an asset for making a better decisions which can be act as a supreme driver of business value. Now a days, Python is one of the fastest growing programming languages. With the help of this programming language, we can easily do the followings —

  • Data manipulation with Pandas, 
  • Creating fabulous visualizations with Seaborn, or
  • Scaling Analytics, Deep Learning and AI Data model with TensorFlow,
Python — A Tool for Everything
Python — A Tool for Everything

So, we can trust on the Python language which seems to have a tool for everything.

In the current era, the volumes of data generated continue to grow at a rapid pace across structured, semi structured, and unstructured data types that businesses are now able to store and need to analyze. 
Few years back, Cloud Technology was considered an optional technology environment but now a days, it is the foundation for modernizing data management and most of the organizations use cloud services or infrastructure widely in their data architecture.
Pandas Library

Pandas is a Python package that provides fast, flexible, and expressive data structures designed to make working with structured like tabular, multidimensional, potentially heterogeneous and time series data both easy and intuitive. It aims to be the fundamental high-level building block for doing practical, real world data analysis in Python.

OS comes under Python’s standard utility modules. This module provides a portable way of using operating system-dependent functionality. os.listdir(‘your_path’) will list all content of a directory

NumPy is a library for the Python programming language, adding support for large, multi-dimensional arrays and matrices, along with a large collection of high-level mathematical functions to operate on these arrays.

SQLite3 can be integrated with Python using sqlite3 module, which provides an SQL interface compliant with the DB-API 2.0 specification described by PEP 249. You do not need to install this module separately because it is shipped by default along with Python version 2.5.x onwards.
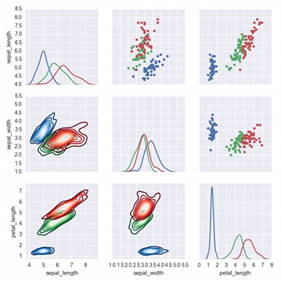
Seaborn is a Python data visualization library based on matplotlib. It will be used to visualize random distributions and provides a high-level interface for drawing attractive and informative statistical graphics.

Matplotlib is a comprehensive library for creating static, animated, and interactive visualizations in Python, and its numerical mathematics extension NumPy. It provides an object-oriented API for embedding plots into applications using general-purpose GUI toolkits like Tkinter, wxPython, Qt, or GTK.

TensorFlow is a free and open-source software library for machine learning and artificial intelligence. It is an end-to-end open source machine learning platform for everyone and can be used across a range of tasks but has a particular focus on training and inference of deep neural networks. TensorFlow is a symbolic math library based on dataflow and differentiable programming. 
Note: 
1.
Seaborn supports Python 3.7+ and no longer supports Python 2.
2. TensorFlow now supports Python 3.5.x through Python 3.8.x, but you still have to use a 64-bit version.


To learn more, please follow us -
http://www.sql-datatools.com

To Learn more, please visit our YouTube channel at —
http://www.youtube.com/c/Sql-datatools

To Learn more, please visit our Instagram account at -
https://www.instagram.com/asp.mukesh/

To Learn more, please visit our twitter account at -
https://twitter.com/macxima


Thursday, August 26, 2021

Python - Common Functions for Exploratory Data Analysis

In this tutorial, we will learn "Common Functions for Exploratory Data Analysis" in our Data Science processes by using Python.

Python is one of the fastest growing programming languages.
1. Whether it’s data manipulation with Pandas,
2. Creating visualizations with Seaborn, or
3. Deep learning with TensorFlow,
Python seems to have a tool for everything.

Pandas is a Python package that provides fast, flexible, and expressive data structures designed to make working with structured (tabular, multidimensional, potentially heterogeneous) and time series data both easy and intuitive. It aims to be the fundamental high-level building block for doing practical, real world data analysis in Python.

NumPy is a library for the Python programming language, adding support for large, multi-dimensional arrays and matrices, along with a large collection of high-level mathematical functions to operate on these arrays.

In the Data Science, in the most cases is not to explore the data but it is something about to analyze the data in some way, often through a model.

Pandas DataFrame is a 2-dimensional labeled data structure with columns of potentially different types. It is similar to an excel spreadsheet or SQL table, or a dict of Series objects. It is generally the most commonly used pandas object. Like Series, DataFrame accepts many different kinds of input:

• Dict of 1D ndarrays, lists, dicts, or Series

• 2-D numpy.ndarray

• Structured or record ndarray

• A Series

• Another DataFrame

Along with the data, we can optionally pass index (row labels) and columns (column labels) arguments. After passing an index and / or columns, we are guaranteeing the index and / or columns of the resulting DataFrame. Thus, a dict of Series plus a specific index will discard all data not matching up to the passed index

1. Pandas.Dataframe.describe() is very informative function which is used to generate descriptive statistics of the data in a Pandas DataFrame or Series. It summarizes central tendency and dispersion of the dataset. describe() helps in getting a quick overview of the dataset.

2. Head and tail functions - If you want to view a small sample of a Series or DataFrame object, use the head() and tail() methods. The default number of elements to display is five, but you may pass a custom number.

import pandas as pd

import numpy as np


#Create a series with random numbers

s = pd.Series(np.random.randn(400))


#The first two rows of the data series:

print(s.head(2))


#The last two rows of the data series:

print(s.tail(2))


#Create a Dictionary of series

d = {'Name':pd.Series(['Tom','James','Ricky','Vin','Steve','Smith','Jack']),

'Age':pd.Series([25,26,25,23,30,29,23]),

'Rating':pd.Series([4.23,3.24,3.98,2.56,3.20,4.6,3.8])}


#Create a DataFrame

df = pd.DataFrame(d)


#The first two rows of the data frame

print(df.head(2))


#The last two rows of the data frame

print(print df.tail(2))


As we know Exploratory Data Analysis (EDA) is one of the most essential part of your data science process.

To learn more, please follow us -

http://www.sql-datatools.com
To Learn more, please visit our YouTube channel at -
http://www.youtube.com/c/Sql-datatools
To Learn more, please visit our Instagram account at -
https://www.instagram.com/asp.mukesh/
To Learn more, please visit our twitter account at -
https://twitter.com/macxima