 Today,
I was working with Python where I have to transpose some columns into rows to
avoid a lot of calculations. As we know that Python has a lot of libraries and
very strong communities support. That means, you can solve any problems with
your dataset.
Today,
I was working with Python where I have to transpose some columns into rows to
avoid a lot of calculations. As we know that Python has a lot of libraries and
very strong communities support. That means, you can solve any problems with
your dataset.Here,
I’m using a small dataset to show you that how can we use pandas library to
transpose your dataframe.
In
this example, I’m using class student’s dataset where each student has their
subject in the columns with their obtained marks.
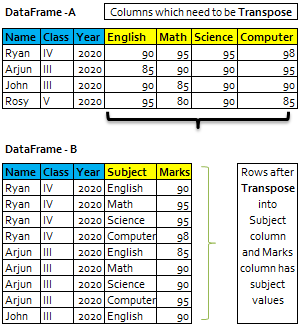
Now,
we have to transpose subject columns into rows in the ‘Subject’ column and
marks will be display in Marks column next to Subject within dataset-2.
Pandas
melt() function is used to change the DataFrame format from wide to long. It’s
used to create a specific format of the DataFrame object where one or more
columns work as identifiers. All the remaining columns are treated as values
and unpivoted to the row axis and only two columns — variable and value.
Here, we can see that with the help of Pandas library, we can
transpose our dataset into the desired results.
|
#import Libraries import pandas as pd # Creating DataFrame from dict of narray/lists. intialise data of lists list={'Name':['Ryan','Arjun','john','Rosy'],
'Class':['IV','III','III','V'],
'English':[90,85,90,95], 'Math':[95,90,85,80], 'Science':[95,90,90,90], 'Computer':[98,95,90,85],
'Year':[2020,2020,2020,2020]} # Create DataFrame from list/narray df=pd.DataFrame(list) #show data in the dataframe df ====================================================== Name | Class | Year| English | Math |Science |Computer ------------------------------------------------------ Ryan |IV | 2020 | 90 | 95 | 95
|98 Arjun|III | 2020 | 85 | 90 | 90
|95 John |III | 2020
| 90 | 85 | 90 |90 Rosy |V | 2020 | 95 | 80 | 90
|85 ====================================================== # function to unpivot the dataframe df3=df.melt(['Name','Class','Year'], var_name='Subject') #show data in the dataframe df3 ======================================= |Name | Class |
Year|Subject |value --------------------------------------- 0 |Ryan | IV |2020 |Computer| 98 1 |Arjun| III |2020 |Computer| 95 2 |john | III |2020 |Computer| 90 3 |Rosy | V |2020 |Computer| 85 4 |Ryan | IV |2020 |English | 90 5 |Arjun| III |2020 |English | 85 6 |john | III |2020 |English | 90 7 |Rosy | V |2020 |English | 95 8 |Ryan | IV |2020 |Math | 95 9 |Arjun| III |2020 |Math | 90 10|john | III |2020 |Math | 85 11|Rosy | V |2020 |Math | 80 12|Ryan | IV |2020 |Science | 95 13|Arjun| III |2020 |Science | 90 14|john | III |2020 |Science | 90 15|Rosy | V |2020 |Science | 90 ======================================= #rename value columns to Marks df3=df3.rename(columns = {'value': 'Marks'}, inplace = False) #show data in the dataframe df3 ======================================= |Name | Class |
Year|Subject |Marks --------------------------------------- 0 |Ryan | IV |2020 |Computer| 98 1 |Arjun| III |2020 |Computer| 95 2 |john | III |2020 |Computer| 90 3 |Rosy | V |2020 |Computer| 85 4 |Ryan | IV |2020 |English | 90 5 |Arjun| III |2020 |English | 85 6 |john | III |2020 |English | 90 7 |Rosy | V |2020 |English | 95 8 |Ryan | IV |2020 |Math | 95 9 |Arjun| III |2020 |Math | 90 10|john | III |2020 |Math | 85 11|Rosy | V |2020 |Math | 80 12|Ryan | IV |2020 |Science | 95 13|Arjun| III |2020 |Science | 90 14|john | III |2020 |Science | 90 15|Rosy | V |2020 |Science | 90 ======================================= |
To Learn more, please visit our YouTube channel at -
http://www.youtube.com/c/Sql-datatools
To Learn more, please visit our Instagram account at -
https://www.instagram.com/asp.mukesh/
To Learn more, please visit our twitter account at -
To Learn more, please visit our Medium account at -


