 Today,
I was working with Python where I have to transpose some columns into rows to
avoid a lot of calculations. As we know that Python has a lot of libraries and
very strong communities support. That means, you can solve any problems with
your dataset.
Today,
I was working with Python where I have to transpose some columns into rows to
avoid a lot of calculations. As we know that Python has a lot of libraries and
very strong communities support. That means, you can solve any problems with
your dataset.Here,
I’m using a small dataset to show you that how can we use pandas library to
transpose your dataframe.
In
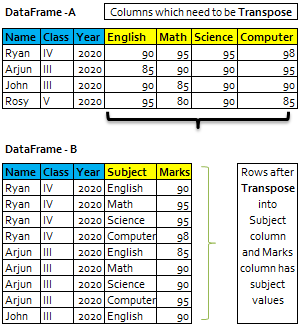
this example, I’m using class student’s dataset where each student has their
subject in the columns with their obtained marks.
Now,
we have to transpose subject columns into rows in the ‘Subject’ column and
marks will be display in Marks column next to Subject within dataset-2.
Pandas
melt() function is used to change the DataFrame format from wide to long. It’s
used to create a specific format of the DataFrame object where one or more
columns work as identifiers. All the remaining columns are treated as values
and unpivoted to the row axis and only two columns — variable and value.
Here, we can see that with the help of Pandas library, we can
transpose our dataset into the desired results.
|
#import Libraries import pandas as pd # Creating DataFrame from dict of narray/lists. intialise data of lists list={'Name':['Ryan','Arjun','john','Rosy'],
'Class':['IV','III','III','V'],
'English':[90,85,90,95], 'Math':[95,90,85,80], 'Science':[95,90,90,90], 'Computer':[98,95,90,85],
'Year':[2020,2020,2020,2020]} # Create DataFrame from list/narray df=pd.DataFrame(list) #show data in the dataframe df ====================================================== Name | Class | Year| English | Math |Science |Computer ------------------------------------------------------ Ryan |IV | 2020 | 90 | 95 | 95
|98 Arjun|III | 2020 | 85 | 90 | 90
|95 John |III | 2020
| 90 | 85 | 90 |90 Rosy |V | 2020 | 95 | 80 | 90
|85 ====================================================== # function to unpivot the dataframe df3=df.melt(['Name','Class','Year'], var_name='Subject') #show data in the dataframe df3 ======================================= |Name | Class |
Year|Subject |value --------------------------------------- 0 |Ryan | IV |2020 |Computer| 98 1 |Arjun| III |2020 |Computer| 95 2 |john | III |2020 |Computer| 90 3 |Rosy | V |2020 |Computer| 85 4 |Ryan | IV |2020 |English | 90 5 |Arjun| III |2020 |English | 85 6 |john | III |2020 |English | 90 7 |Rosy | V |2020 |English | 95 8 |Ryan | IV |2020 |Math | 95 9 |Arjun| III |2020 |Math | 90 10|john | III |2020 |Math | 85 11|Rosy | V |2020 |Math | 80 12|Ryan | IV |2020 |Science | 95 13|Arjun| III |2020 |Science | 90 14|john | III |2020 |Science | 90 15|Rosy | V |2020 |Science | 90 ======================================= #rename value columns to Marks df3=df3.rename(columns = {'value': 'Marks'}, inplace = False) #show data in the dataframe df3 ======================================= |Name | Class |
Year|Subject |Marks --------------------------------------- 0 |Ryan | IV |2020 |Computer| 98 1 |Arjun| III |2020 |Computer| 95 2 |john | III |2020 |Computer| 90 3 |Rosy | V |2020 |Computer| 85 4 |Ryan | IV |2020 |English | 90 5 |Arjun| III |2020 |English | 85 6 |john | III |2020 |English | 90 7 |Rosy | V |2020 |English | 95 8 |Ryan | IV |2020 |Math | 95 9 |Arjun| III |2020 |Math | 90 10|john | III |2020 |Math | 85 11|Rosy | V |2020 |Math | 80 12|Ryan | IV |2020 |Science | 95 13|Arjun| III |2020 |Science | 90 14|john | III |2020 |Science | 90 15|Rosy | V |2020 |Science | 90 ======================================= |
To Learn more, please visit our YouTube channel at -
http://www.youtube.com/c/Sql-datatools
To Learn more, please visit our Instagram account at -
https://www.instagram.com/asp.mukesh/
To Learn more, please visit our twitter account at -
To Learn more, please visit our Medium account at -


The article demonstrates how the Pandas melt() function can be used to transform DataFrames from a wide format into a long format by converting multiple columns into rows. This data reshaping technique simplifies analysis, reporting, visualization, and preprocessing tasks, making datasets easier to work with for statistical analysis and machine learning. Understanding operations such as melt(), pivot(), and transpose() is essential for efficiently managing structured data in Python.
ReplyDeletePandas provides powerful DataFrame transformation functions that enable developers to reshape, filter, aggregate, and preprocess datasets with minimal code. Functions like melt() are particularly useful for converting raw tabular data into formats suitable for analytics, visualization, and predictive modeling. Students and professionals interested in mastering these practical techniques can explore Pandas Training, which covers real-world DataFrame manipulation, reshaping, and analytical workflows.
Data transformation is a critical step in machine learning pipelines, where properly structured datasets improve feature engineering, model training, and prediction accuracy. Efficient preprocessing techniques help developers prepare high-quality data for intelligent analytics and AI applications. Those interested in applying these concepts to practical AI solutions can explore Machine Learning Projects for Final Year, featuring hands-on implementations involving data preprocessing, predictive modeling, and intelligent data-driven systems.
ReplyDeleteReaders interested in expanding their Python data science skills can also refer to Python Training, which introduces essential Python libraries, frameworks, and concepts widely used in data analysis, machine learning, data engineering, and Artificial Intelligence.
ReplyDelete